Sunday 27 May 2018

Stock bought May 2018: ETF Greece


Logo of Global X 2018

Some weeks ago ECB finished their stress test of the banks in Greece. There were some commotion around it because one CEO stepped down etc. but the general information given by ECB was that they all passed the stress test. Unfortunately the index in Greece is to a large extent dominated by their banks and if they would not live up to the requirements by ECB then the index would be far, far away from any form of recovery. Now at least there is a chance for this to happen. Looking into the financial statement of the banks then they are still not doing well but my thought is that if they have now passed the requirements of the ECB then they can reallocate their resources elsewhere which would for instance be into making money.

I think that I might still be a couple of years too early with this investment but sometimes it is good to make it so that one keep watching it. On top of things I hardly had any money this month due to two reasons: Break down of cars and being forced to repair them and secondly massive, for me, expenses that I must carry for the company. I doubt that next month will be better.

I therefore bought 130 parts at a total cost of 1127.69 € including fees.

To take a look at my current Stock Portfolio then please click on the link. The portfolio will however not be fully updated until the end of the month.

Friday 11 May 2018

Summary of April 2018


Summary of April 2018


April was very interesting. It started off pretty bad but lately things have just gone a like a rocket on the stock market. The German banks keep pulling down my stock portfolio as they have done since 2012. It has been said many times and I can only agree... never underestimate the time it takes for a turn-around to actually turn around.

My work is going very well. I am and have been for some time overloaded so I have decided to take a week in my summerhouse to clear my mind and to be able to focus on finding a new job. At the moment I, just to stay afloat, I have not had the time to search and apply for new jobs as well as I would have liked to.

Both my cars are now giving me plenty of sorrow. I went to the garage to pick it up hopefully fixed and with an MOT finished only to realise that they had forgotten to make the MOT. I took it anyway but after driving 50 meters I had to bring it back due to the breaks being completely messed up... sigh... The other car, my Renault, have recently started to just shut down the engine at stop lights etc. and once that happens then I am almost unable to get it started again. Last night it did not start and I had to call AA that arrived after 3 hours of waiting only to say that they could not fix it for me. Grrr... Only once have a proper AA repair mechanic arrived to help me out and it was excellent service every other time it has been "outsourced" to a company that clearly are not as competent. I therefore do not hold AA in high regards here in the UK.

For the previous summary please visit Summary of February 2018 and here you can see my stock portfolio as it is.

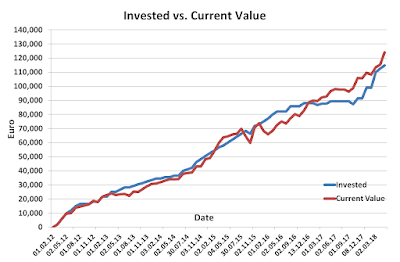
Invested vs Current April 2018

The total invested value is now up at: 114,776 €. During the month of April I picked up some more of ETF Russia simply because the Russian economy is so dependent on it and the price for oil keeps going up.

Current investments April 2018

The value of the portfolio is today: 124,094 € and spread out I now have around 4,025 € in cash on the different accounts. I have a realised gain of 2,857 € and the unrealised gain is now at: 9,319 € (8%) which is not good at all but the saga continues.


DAX increased a lot during April and is now up at 12,820 point which means it increased by 6.8% while my own portfolio only increased by 5.7% in the same period.

Conclusion: DAX did better once again. The German banks keep dragging me down and on top of that my massive investment in ETF Portugal is not moving as I would have liked. I need to make a new investment in the coming two weeks but I still do not know what to buy.

Thursday 10 May 2018

Dividends from Nike and ETF Oil: April 2018


Logo of Nike 2018

From my 40 shares in Nike I received a total of 6.49 € in dividends. On this I paid 0.97 € in taxes and I was left with 5.52 € in cash on my broker account.

To find out more about Nike then please click here.


Logo of BlackRock 2018

For my 185 parts in the BlackRock oil ETF I received a total of 30.65 €. On this I paid no taxes and everything is available as cash on my broker account.

To find out more about my ETF Oil please click here.

To see my total dividend flow then please visit the Stock Dividends page that has now been updated.

Wednesday 9 May 2018

Reflection on companies


The annual reports started with the British sugar, food and retail company Associated British Foods and ended with

the Russian car producer Avtovaz. This marks the end of the annual reports as well as the analysis of the individual companies that I currently hold in my portfolio.

What we can see is that the German banks are still not doing well six years down the line from the initial investment. We have seen that the German electricity companies are having a great year and on top of that are shaking up the entire market. We have seen that some retail companies have been highly successful and others have not. With the chemical companies we have to draw the same conclusion as for retail. The oil companies are doing well but not the oil service companies because they are still struggling as are the mining companies connected to agriculture. The american companies were hit by massive taxes but were besides from that doing very well which is a promising signal for 2018 especially since they will now pay less taxes.

I now hold 25% of my investment portfolio in ETFs and 35% if I include the company pension scheme that I am involved in. I am not yet up at 50% which I would have liked to be but I am moving towards it with giant leaps at the moment since I am saving over 60% of my salary each month. June will however become a month will a lower savings %-age since I big block of annual bills will arrive then.

I once again took a look at my biggest failed investment which was Asian Bamboo to remind myself concerning the size of that failure that I had so early in my portfolio build up period and how long that has had an impact. If only I had started with ETFs instead of making the inverse journey. I saw the signs in Asian Bamboo and yet I did not have the confidence to react on it. Is confidence the correct word? Did I remain due to curiosity? Due to my initial, very stupid, buy rule that I then had? In the final stages I remained due to that I considered that it was hardly even worth it to sell the shares before I finally did push the sell button. In general those initial investments have all performed extremely poorly for me and have lead to a long term drag on the portfolio that I still today have problems to catch up with. 

With each failure I have tried to tweak my investment approach. Is that wrong? Should the focus instead be to look upon the good investments and make up rules based on what I then saw before I made the investment? MüRe, Adidas, Enel and Deere were all great buys but should I have sold them? MüRe and Adidas I definitely should not have sold while I am still not certain when it comes to Enel and Deere. Kernel was a perfect sale but should I have bought it in the first place? One thing is for certain... it is not easy.

Tuesday 8 May 2018

Analysis of Avtovaz 2018


Avtovaz, a Russian car producer

Company: Avtovaz 

ISIN US05453R1014 | WKN 576848

Business: A Russian automotive company. They are the biggest personal car producer in Russia with their own brand, Lada, as well as having production for, for instance, Renault and Nissan which are their largest shareholders. Today they have almost 20% of the Russian market and they hope to increase that as well as increasing export.

Active: In 46 countries with the biggest market being Russia.

P/E: -6.9

Here you can find the previous analysis of Avtovaz 2016... missed last year.

Contrarian analysis of Avtovaz 2018 with P/E, P/B, ROE as well as dividend.

The P/E is bad with -6.9 due to losses and the P/B is equally bad with -1 which gives a clear no go from Graham. Earnings to sales, ROE and book to debt ratio due to losses as well as having negative equity.
In the last five years they have however shown an excellent yearly revenue growth rate of 5% which gives us a motivated P/E of 13 to 18. I am unable to make a statement since they are making losses.
They spend money on R&D which is good but what is crucial for Avtovaz moving forward is of course increased sales and cost control.
They, correctly so, pay out no dividends.

Conclusion: Graham says no and so do I. Is there a future for Avtovaz? I tend to think so but without any earnings it is very difficult to give them a reasonable valuation today. I will remain as a grumpy shareholder due to the loss of Bo Inge Anderson.

Monday 7 May 2018

Avtovaz annual report 2017


Front page of Avtovaz annual report 2017


For the report in full please go here and to read my previous summary please click on Avtovaz annual report 2016 and to find out more regarding Avtovaz then please visit Analysis of Avtovaz 2016. It appears as if I got so annoyed with the changes in Avtovaz that I did not make an analysis of the company during 2017.

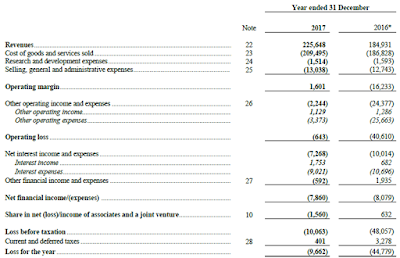
In the income statement below we see that there was a significant increase in the revenue for Avtovaz in 2017. The costs unfortunately also increased and we ended up with yet another year of losses but much less than in 2016. Reading the sales for Q1 of 2018 then Avtovaz is doing very well. We are of course still dealing with a significant negative equity in Avtovaz which is also very clearly stated by the accounting company.


Income statement of Avtovaz 2017


Conclusion: Avtovaz is doing better and by the look of things their new models (developed by Bo Inge Andersson) appears to have been highly successful that now the new french CEO can harvest. I will remain as a shareholder.

Sunday 6 May 2018

Analysis of VW 2018


Logo of VW 2018


Company: Volkswagen 

ISIN DE0007664039 | WKN 766403 

Business: A German automobile manufacturer. The are still producing motorcycles, cars, trucks, large-bore diesel engines, turbochargers, turbo machinery, compressors and chemical reactors. They are however most famous for their cars and here are the Volkswagen brands. The next time you go for a spinn with your Ducati remember it is a Volkswagen you are sitting on and never forget that the many will always beat the few in the end... one way or the other. 

Active: World wide with sales in 153 countries. 

P/E: 7.6

Here you can find the previous analysis of VW 2016

Contrarian analysis of VW 2018 with P/E, P/B, ROE as well as dividend.

The P/E for VW is excellent with 7.6 as is the P/B which is only at 0.8 which gives a clear buy signal from Graham. The earnings to sales are so, so with 5% and the ROE is not the best with only 10% while the book to debt ratio is at 0.35 which is also not superb but these days all these companies have leasing as part of their model for making the sales.
In the last five years they have had a yearly revenue growth rate of 3.2% which gives us a motivated P/E of 10 to 15 which means that VW is undervalued by the market.
The spend a large chunk of money on R&D since it corresponds to over 100% of their earnings.
They pay a tiny dividends in the size of 2.3% which happily corresponds to 17% of their earnings so there is room for improvement but by the look of things they tend to enjoy to keep the money.

Conclusion: Graham directly says yes and I am also not negative however what nags in the back of my head is that harder times will come and probably more sooner than later. Anyway the P/E and P/B is excellent while the ROE and dividends are not something to brag about. I will remain as a shareholder.

Saturday 5 May 2018

VW annual report 2017

Front page of VW 2017 annual report

To read the report in full please go here and to read the previous summary then please click on VW annual report 2016 and to find out more regarding VW then please visit analysis of VW 2017. 

In the financial statement below we can directly see that VW is back on their feet again. The revenue is up from 217 to 231 billion € and the earnings have gone from 5.4 to 11.4 billion €. It looks very good at the moment for VW. 


Income statement from VW 2017


Conclusion: VW have started to do well again and their earnings are up at a high level again. The consumer world seems to be happy and highly active and apparently likes to buy German cars. I realise that I should have bought more on the dip during diesel-gate (I am sure more will come) but my experience from BP with the length and final costs simply made me cautious to do so. In this case it was probably wrong but in the next situation and case it might be a correct decision again. Future will, as always, tell. I will remain as a shareholder. That said as a life advice for building a stock portfolio to all of you: please do not buy new cars and try to drive the car you have into the ground.

Friday 4 May 2018

Analysis of TJX 2018


Logo of TJX 2017

Company: TJX 

ISIN US8725401090 | WKN 854854 

Business: An American off-price apparel and home fashions retailer. They use several store names based on take overs and store concept and in the U.S. they have T.J. Maxx, Marshalls, HomeGoods, Sierra Trading Post and in Canada they have Winners, HomeSense, Marshalls and in Europe they got T.K. Maxx and HomeSense. 

Active: in the US, Canada, the Netherlands, Germany, the UK, Poland, Ireland Austria and Australia.

P/E: 22.0

Here you can find the previous analysis of TJX 2017

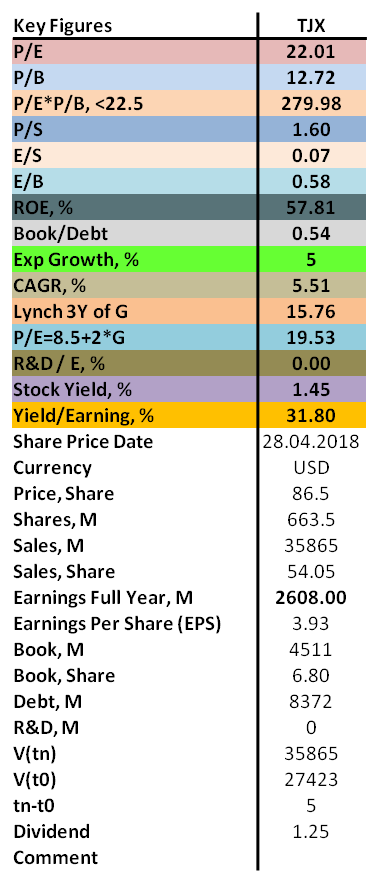
Contrarian analysis of TJX 2018 with P/E, P/B, ROE as well as dividend.

The P/E of TJX is a bit on the high side with 22.0 and the P/B is extremely high with 12.7 which gives a clear no go from Graham. The earnings to sales are so, so with 7% and the ROE is excellent with 58% but due to debt leverage. The book to debt ratio is low with 0.6.
In the last five years they have shown an impressive yearly revenue growth rate of 5.5% which then also gives us a motivated P/E of 16 to 20 which means that TJX is today slightly overvalued by the market.
They pay a silly dividend in the size of 1.45% which corresponds to 32% of their earnings so it should be easy to maintain as well as increase in the future.

Conclusion: Graham says no and so do I. Today they are simply fairly valued by the market but on the other hand they are not so overvalued that it is worth to cash in on the investment and therefore I will remain as a shareholder.

Thursday 3 May 2018

TJX annual report 2017


Front page of TJX 2017 annual report

As you notice I could not be bothered to wait for the "pretty" annual report and instead I went to the 10-K from SEC to get the data that I needed.

To read the report in full please go herefor my previous summary please visit TJX annual report 2016 and to find out more about TJX then please click on analysis of TJX 2017.

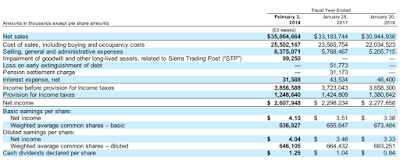
In the brief income statement below we can see that TJX continue their wonderful growth rate taking by stepping into one country after another. They have now also started to step into the Australian market. The revenu increased form 33.1 to 35.9 billion USD. Very good! When it comes to earnings they went from 2.3 to 2.6 billion USD which has lead to them making a dividend increase of 25%. To be fair though... their dividend payments have always been tiny so 25% of something that was almost nothing is still pretty much nothing.

Income statement of TJX 2017

Conclusion: TJX continue to do well and their strategy and market share is growing at a rapid yet sustainable rate. I am very pleased with this investment and will remain as a shareholder.

Wednesday 2 May 2018

Analysis of Tessenderlo 2018


Logo of Tessenderlo 2018

Company: Tessenderlo 

ISIN BE0003555639 | WKN 852064

Business: A Belgian chemical company. They currently have three operating segments : Agro (~40% of revenue with liquid crop nutrients, water soluble SOP and crop protection), Bio-Valorization (~31% of revenue with gelatine, pharmaceuticals, body-care and bio-resources) and finally Industrial Solutions (~29% of revenue with pipes, water treatment and mining).

Active: 21 countries and 100 locations.

P/E: 57.5

To find out more concerning Tessenderlo then please go to analysis of Tessenderlo 2016.

Contrarian analysis of Tessenderlo 2018 with P/E, P/B, ROE as well as dividend.

The P/E of Tessenderlo is awful with 57.5 and the P/B is ok but not great with 2.3 which gives a clear no go from Graham. Earning to sales are too low with only 2% and the ROE is also horrible with 4% while the book to debt to book ratio is acceptable with 0.8.
In the last five years they have shown a yearly revenue decline of -1.5% which is not good and therefore gives us a motivated P/E of around 8 which means that Tessenderlo is overvalue by the market today.
They pay out no dividends.

Conclusion: Graham says no and so do I. Tessenderlo needs to start proving themselves before it will be interesting to push in more money there again. Now they have bought themselves, probably, a massive revenue increase that will most likely appear during the 2nd half of 2018 but they did that with cash and by overtaking debt. I will remain as a shareholder and have had until today's date a good development on that investment which has probably been more due to Luc than anything else. One day, not very far away, investors will want to see something concerning Tessenderlo.

Tuesday 1 May 2018

Tessenderlo annual report 2017

Front page of Tessenderlo 2017 annual report
 For the report in full please click here and to see my previous summary then please visit Tessenderlo annual report 2016 and to find out more concerning Tessenderlo then please go to analysis of Tessenderlo 2017.

Below is the financial statement and it looks like a middle year. The earnings increased slightly compared to 2016 but the earnings was only 1/3 of last years. The invested and have now started up production of a liquid fertiliser that can be used both by households as well as by farmers. In the Q1 of 2018 they have also decided to buy out a energy producing plant that they previously owned 20% of for, as they mention, sustainability reasons as well as flexibility. When I calculated the P/E that they paid for that it was up around 20 which I find very expensive (they paid ~350 M €) especially since the earnings of that unit comes from a year when pretty much all energy producing companies have made nice profits. This makes me a little concerned. However... the reason for this investment was made on the leader Luc and his ability to find value so all will, I am sure, be good in the end.

Income statement of Tessenderlo 2017

Conclusion: Not a very good year for Tessenderlo but due to the latest deals I suspect that there will be a massive increase in revenue from the Tessenderlo Group as they now call themselves.