Thursday, 29 March 2018

Analysis of Cez 2018


Logo of Cez 2018


Company: Cez 

ISIN CZ0005112300 | WKN 887832 

Business: A Czech electricity producer and distributor. They offer heat and gas to consumers and are active with telecommunications, informatics, nuclear research, planning, construction and maintenance of energy facilities, mining raw materials, and processing energy by-products. 

Active: Czech Republic, Poland, Bulgaria, Hungary, Slovakia, Romania and in Turkey.

P/E: 14.5

Here you can find the previous analysis of Cez 2017


The P/E of Cez is looking reasonable with 14.5 and the P/B is great with 1.1 which gives a clear buy from Graham. The earnings to sales are ok with 9% but the ROE is just not good enough with 7.5. The book to debt ratio is great with 1.9.
In the last five years they have had a negative revenue growth rate of -1.5% which is bad and it gives us a motivated P/E of around 10 which means that Cez is over valued by the market.
They pay an excellent dividend of 6.5% however this corresponds to 95% of their earnings so they need to stop this in my opinion since it is not sustainable and they have been doing this for a long time now.

Conclusion: Graham says yes but I say no. Sure the P/E, P/B and dividend is good but the ROE is not and considering that plenty of that earnings came from sale of business they are actually not as good as they look at this moment. I will continue as a grumpy shareholder.

Wednesday, 28 March 2018

Cez annual report 2017


Front page of Cez annual 2017 report

For the report in full please go here, to see the previous summary please visit Cez annual report 2016 and to find out more regarding Cez then click on analysis of Cez 2017.

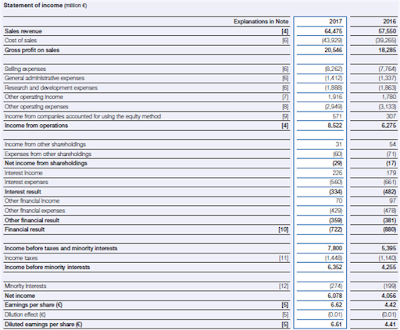
Cez are still far from their glory days. They show a flat revenue compared to 2016 but their earnings increased by around 4.5 billion of which, and this should be kept in mind, 4.6 billion comes from the sale of a daughter company. So with that in mind then 2017 was actually a worse year than 2016. On top of this they had an increase in earnings from green energy as well as from gas so their classical source of revenue and earnings took a big hit.


Income statement of Cez 2017


Conclusion: Cez is not doing very well and the only thing that I see that can save them is the strong winter months that we have had in Europe during Q1. They have also sold yet another daughter company, in Bulgaria, which will bring back some cash but that of course also leads to decreased future revenue and earnings. I will remain as a grumpy shareholder biding my time.

Tuesday, 27 March 2018

Analysis of K+S 2018


Logo of K+S 2018


Company: K+S 

ISIN DE000KSAG888 | WKN KSAG88 

Business: A German commodities company that are mining and processing raw materials. The group is divided into the two segments Potash & Magnesium (that is being used as standard and speciality fertilizers for enhancing the agricultural harvests) and Salt (de-icing, purified salt that are used for instance as table salt etc.). Lately their best business has been salt.

Active: Main focus in Europe and North America. Minor presence in South America and Asia. 

P/E: 23.9

For the previous please click on analysis of K+S 2017.

Contrarian analysis of K+S 2018 with P/E, P/B, ROE as well as dividend.

The P/E of K+S is far too high with 23.9 but the P/B is excellent with 1.1, still Graham gives this an overall no go due to the high P/E. The earnings to sales are still low with only 5% and the ROE is appalling with 4.4%. The book to debt ratio is so, so with 0.7.
In the last five years they have had a yearly negative revenue growth rate of -1.7% which is awful and this gives us a motivated P/E of around 10 which means that K+S is over valued by the market today. They are focusing slightly more on R&D which I find very good because they are now up at 9% of their earnings going towards that. They are aspiring to focus more on the end consumer which companies always seem to do when they intend to push up their margins.
They pay a silly dividends of 1.5% which only corresponds to 36% of their earnings so they could push that up higher but it is clear that the new management wants space to manoeuvre.

Conclusion: Graham says no and so do I. K+S must now really show that they can increase their margins and that their new mine in Canada are making some nice money to us shareholders before there is any interest in stepping into it. Only good indicator is the P/B value and the rest of them look dreadful. I will remain as a shareholder.

Monday, 26 March 2018

K+S annual report 2017


Front page of K+S annual 2017 report

Plenty of things has happened in K+S during 2017. They have a new CEO and a couple of new board members. They have managed to make their first delivery from Canada and they have closed down one potash mine in Germany which has for a long time had yearly productivity decreases and due to the opening of the new mine in Canada they could now take the decision to close it down.

For the report in full please click here and for the previous summary please go to K+S annual report 2016 and to find out more about them then please click on analysis of K+S 2017.

As a shareholder 2017 was not a year that will go down in history for being one of the better ones. I do however assume that Q1 in 2018 has been very good for K+S in terms of sale of salt in Europe and USA due to the snow masses that arrived. In 2017 the revenue increased slightly but nothing worth mentioning and the earnings also increased but that it was so tiny that it is definitely not worth mentioning.


Income statement K+S 2017


Conclusion: I expected much more from K+S for 2017. By the look of it I significantly underestimated the time it took to get the production in Canada up and running and to actually get a revenue flow coming back from it. I am also not impressed with the dividend that they pay out and on top of that will focus on decreasing debt in 2018 so I doubt that I as a shareholder will receive a big lump of money next year. I will remain as a shareholder.

Wednesday, 21 March 2018

Analysis of BASF 2018


Logo of BASF 2018

Company: BASF

ISIN DE000BASF111 | WKN BASF11

Business: A German chemistry and polymer company. They are still active with five different business units and those are: Chemicals (with intermediates and polymers), Performance Products (pigments, care chemicals, health chemicals and paper chemicals), Functional Materials & Solutions (catalysts, construction chemicals and coatings), Agricultural Solutions (crop protection) and finally Oil & Gas (exploration and extraction).

Active: World wide and as they say themselves "in almost every country in the world". 

P/E: 12.8

For the previous analysis please see analysis of BASF 2017.

Contrarian analysis of BASF 2018 with P/E, P/B, ROE as well as dividend.

The P/E for BASF is excellent with 12.8 but the P/B is a little bit too high with 2.3 which indicates that Graham would not have been interested in buying BASF at this point in time.
The earnings to sales are ok with 9% but better yet it increased from last year. The ROE is up at 18% which is great and the book to debt ratio is ok with 0.8.
In the last five years they have had a negative yearly revenue growth rate of -2.7% which comes from divestment but I would still say that we have a motivated P/E of around 12 which means that BASF is currently normally valued by the market.
They pay a good dividend of 3.7% which correspond to 47% of their earnings so they can sustain it but they need to push up their earnings a bit.

Conclusion: Graham is not fully satisfied with BASF but I am. I consider the P/E, ROE and dividends to be fully acceptable for stepping into BASF which I also did. I will remain as a shareholder.

Tuesday, 20 March 2018

BASF annual report 2017


Front page of BASF annual 2017 report


It is interesting when one talks to employees in BASF. Once you have been hired you apparently pretty much cannot get fired. The possibilities to promotions are also weak. This means that many of the ambitious employees with a drive leave the company and the people that remains are well... there between nine to five. It is sad to hear and it would be interesting to get statistics on what a person must do to actually get fired in Europe (ex. UK).

For the report in full please go here and for the latest summary which was the BASF annual report 2016 then please click on that link and to find out more about The Chemical Company then please visit analysis of BASF 2017.

In the last three years BASF has taken a significant drop in revenue due to divesting however last year looked pretty weak and by the look of things their new strategy is taking off. Less revenue but more profit. I like it! I only wish that IBM would at some stage actually manage to close that equation instead of having both go down year after year. Back to BASF... they are now stepping into lower volume products that sells at a higher margin. They never did this in the past. No matter how large the margin was if the product did not reach a certain volume they simply shut it down. In my book that is idiocy but hey... they are slow but they appear to get it in the end. The revenue was up by
12% which is good but even better then earnings was up by almost 50%. Well done!


Income statement of BASF 2017


Conclusion: I hope that BASF will stay on the path that they are now walking so that those profit margins and earnings can keep increasing! I increased by holding not that long ago and I will remain as a shareholder in BASF for a long time.

Monday, 19 March 2018

Analysis of Fast Retailing 2018


Logo of Fast Retailing 2018


Company: Fast Retailing

ISIN JP3802300008 | WKN 891638

Business: A Japanese retail group. They stand on a couple of brand pillars: UNIQLO (their largest brand), GU (offer low price fashion), Theory (offering fashion for the contemporary woman, launched in New York), COMPTOIR DES COTONNIERS (French origin offering fashion for women), PRINCESSE tam·tam (also French origin offering "lingerie made by women for women") & finally J BRAND (Californian origin offering fashion denim).

Active: Highly brand based but with their biggest one Uniqlo they are present in Japan, China, Hong Kong, Taiwan, South Korea, Singapore, Malaysia, Thailand, Philippines, Indonesia, Australia, USA, UK, France, Germany, Russia and in Belgium. 

P/E: 37.5

Contrarian analysis of Fast Retailning 2018 with P/E, P/B, ROE as well as dividend.

The P/E is far too high for me with 37.5 and the P/B is also obnoxious with 8 which gives a very, very clear no go from Graham.
Their earnings to sales still need to improve because it is down at 6% but I am happy to see the change that has happened since last year. The ROE has also been pushed up slightly and is now at an excellent 21%. The book to debt ratio is also great with 1.8.
in the last five years they have managed to have a yearly revenue growth rate of over 10% which is great which then gives us a motivated P/E of 26 to 29 which means that they are still over valued by the market.
They pay out a tiny dividend of 0.8% which shockingly correspond to 33% of their earnings so they better start making more money soon.

Conclusion: Graham very clearly says no and so do I. The P/E is too high and the dividends are too low. I hope that 2017 was the year that changed Fast Retailing and that we will only see stronger and stronger improvements but I am afraid to make any such claims of it actually being the case. The e-shopping is a far too powerful movement at the moment. I will remain as a shareholder.

Sunday, 18 March 2018

Fast Retailing annual report 2017


Front page of the annual 2017 report from Fast Retailing

It is not their "true" annual report but it is from the publication that they made with the results.

For the report in full please go here, to find out more concerning Fast Retailing then please visit analysis of Fast Retailing 2017.

As can be seen in the income statement below Fast Retailing have started to do much better again. They had some hard years and hopefully they have finally managed to turn it around. The biggest problem they had was with their domestic market, so in Japan, where they were forced to shut down a couple of stores but now it seems as if they have managed to push up the margins again due to this. The revenue increase is only so, so with +4% but the profit increase is excellent with +148% which tells more about the sorry state that they were in than what it has to do with the earnings really being spectacular. Still it is a good start!


Income statement of Fast Retailing 2017


Conclusion: I hope that this was now the turning point for Fast Retailing. That they have closed down the majority of stores that they needed to deal with due to over expansion + the staggering increase of sales over internet. I will remain as a shareholder.

Friday, 16 March 2018

Analysis of DBAG 2018

DBAG, logo, 2018


ISIN DE000A1TNUT7 | WKN A1TNUT 

Business: A German private equity company. Their focus lies with the management buy out of small and medium sized companies that have excellent products. To see their full company portfolio then please click here. They divested six companies and invested in five new ones during 2017.

Active: Germany, and surroundings. Companies are sometimes more globally oriented. 

P/E: 6.9

Here you can find the previous analysis of DBAG 2017.

Contrarian analysis of DBAG with P/E, P/B, ROE and dividend

The P/E is excellent with 6.9 and the P/B is also great which leaves us with a clear buy signal from Graham. The earnings to sales are artificial due to the nature of their business and reporting but the ROE is great with 20.3%. Since they have pretty much no debt also the book to debt ratio is excellent with almost 16.
In the last five years they have had an amazing yearly growth rate which, to be honest, comes from 2017 being an insanely profitable year which therefore have given them a value of almost 22%. This then gives us a motivated P/E value of around 20.
They pay out an acceptable dividend in the size of 3.3% which only corresponds to 23% of their earnings so there is room for them to increase.

Conclusion: Graham says yes and so do I. The P/E is excellent as is the P/E and ROE. The dividends is fully acceptable but one must keep in mind that 2017 was an extraordinary year and having more "normal" earnings in mind then the P/E would have been doubled and the investment benefit is no longer as clear. I will keep my shares but I will not invest any more money at this moment into DBAG.

Thursday, 15 March 2018

DBAG annual report 2017


Front page of the annual 2017 report from DBAG

Please make sure that you are viable to read the report that can be found in full here. To read the previous summary please go to DBAG annual report 2016 or why not visit the analysis of DBAG 2017.

DBAG had an exceptional year in 2017. They managed to divest several of their investments and made a nice profit out of each and every one of them. I have probably mentioned this before but back in the days when I lived and worked in Germany I met a bunch of these elderly men that had built up the companies but without having any clear heir to their thrones. These companies are perfect for DBAG to make an MBO of.

As can be seen below DBAG increased their earnings from around 43 M € to 93 M €. They decided to increase the dividends to 1.4 € per share which I personally would have loved to see go higher but I am these days fully confident that they will invest my money very well for me and to be honest... better than what I would do so I can live with a small dividend.

Income statement of DBAG 2017

Conclusion: Here I am just letting the flower growing as it sees fit. I am not so confident that they will keep doing this well in ten years from now but that is far, far away into the future. I will remain as a shareholder.

Monday, 12 March 2018

Analysis of ABF 2018


ABF, logo, 2018

Company: ABF

ISIN GB0006731235 | WKN 920876 

Business: A British conglomerate with agriculture, agricultural products as well as retail. Currently they have five business segments: Sugar, Agriculture, Retail, Grocery and Ingredients. To find out more about their grocery brands then please click here and to find out about their businesses in general then please click here.

Active: Europe, Africa, USA and Australia. Heaviest in the UK and Ireland.

P/E: 17.04

Here you can find the previous analysis of ABF 2017

Contrarian analysis of ABF with P/E, P/B, ROE and dividends 2018

The P/E of ABF is still very high but starts to be more reasonable at 17 and the P&B is down at 2.5 which is on the same line as for the P/E however Graham would still not go for the company.
The earnings to sales have improved significantly and are now up at 8% and the ROE is up at 14.5%. The book to debt ratio is good up at a ratio of 1.9.
Th yearly revenue growth rate has increased slightly and is up at 2.9% which gives us a motivated P/E of around 12 to 14 which means that ABF is still slightly overvalued by the market today however is has been a long time since they was this close to a more proper valuation.
The dividends are still silly with only 1.6% which happily correspond to less that 30% of their profits so there is room for improvement.

Conclusion: Graham always said no to this investment and he still does. I realise that I should have taken the money and walked away when they were traded over 50 € per share but since it is impossible to turn back time I just have to suck it up. To be fair ABF start to look like a better investment today than what it ever was however a large part of the profit came from successful sale of business which means that it is not a consistent growth earnings increase and we might expect a decrease during 2018 in earnings if not in revenue. I will not invest more into ABF but I will remain as a shareholder with the long term target of making an IPO of Primark at some point in time.

If this analysis is outdated then you can request a new one.

Sunday, 11 March 2018

ABF annual report 2017


Front page of ABF annual 2017 report

The report from ABF, that was published some time ago, was very good. What I very much liked to see was that Primark keeps growing and on top of this their Sugar business unit have managed to improve their profits. It is still not up at their peak days but it was a very good improvement that they could show us shareholders.

For the report in full please go here and for the previous report from ABF please visit ABF annual report 2016 and to find out more regarding ABF please click on analysis of ABF 2017.

When we look into the table below then we see that they managed to increase their revenue from 13.4 bn GBP to 15.4 bn GBP which is excellent. The costs also increased and the biggest reason for an excellent profit increase (from 0.8 bn GBP to 1.2 bn GBP) comes from that they made a good sale of one of their businesses.


Income statement ABF 2017


The reason why I say that sugar has recovered slightly is due to that they increased their profits from 35 mn GBP to 223 million GBP. Ingredients also did very well with an increase from 93 million GBP to 125 million GBP. Primark had a excellent revenue increase from 5.9 bn GBP to 7.1 bn GBP however the profit increase was only around 40 million which is very clearly showing how the retail business is getting squeezed from all direction.

Conclusion: I am still waiting for Primark to be released from the rest. With a recovering sugar business the chance is getting bigger however with such a low profit increase then the chance of that decreases once again. I will of course remain as a shareholder and will continue to regret that I did not sell them when they were up at over 50 € per share.

Tuesday, 6 March 2018

Stock bought March 2018: BASF


Logo of BASF 2018

I, in my opinion, once again took advantage of the drop in share price of many excellent companies and therefore decided to push in some more money into BASF. Oil prices have increased lately which means that the oil and gas part of BASF should be doing pretty ok and their decision to step more into the consumer market has really taken off. For a long time BASF has been about volumes, volumes, volumes but since the last two years they have stepped into the consumer market that is more risky, yes, but it also provides much higher margins. If you go out into a store and pick up a pair of light weight Adidas sneakers then the sole comes from BASF polymers and from their in-house development. Since they own it that means they can join hands with every other sneaker company in the world. Well done BASF!

At the moment they are trading at a P/E of around 12.5 and yes that is with high earnings still, in my book, it is worth it. I am in this for the long run with my initial investment made 3.5 years ago in BASF.

Before this I had 47 shares with a price of 64.11 € per share including fees. I now bought 33 more shares at a price of 82.18 € which totals 2721.94 € including fees.

I therefore now own 80 shares in BASF with the total price per share of 71.68 € including fees and the entire investment is up at 5734 €.

To find out more regarding BASF then please click here.

If you want to see my current Stock Portfolio then click on the link but the portfolio will not be fully updated until the end of the month.

Sunday, 4 March 2018

Summary of February 2018

Summary of February 2018

February was again a highly interesting month in terms of the stock market. Share prices dropped and there are opportunities for buying high quality companies cheap at this moment. I have, not by own experience but instead learnt by listening to others and thinking about it, realised that I will never be able to time the market movement and are therefore not even attempting to sell any shares during drops such as this one. It is instead a good moment for buying more shares. Due to the bonus that I received in January I had a bit of firepower and I ended up buying two falling knives that, of course, have continued to fall but it is of little concern to me.

I decided to increase my monthly savings in the company pension scheme and from now on I will save around 1k GBP per month into index funds. These investments are not accounted for here but it also means that I will be able to save slightly less privately especially now since I alone are carrying all the costs once again as I did in the beginning of this UK adventure. I think that I will be able to save around 1.5k per month outside of the company pension scheme which is still higher than the 1k € per month that I have in my plan but 500 € less than what I would like to invest per month.

Work is going very well but I must start to focus on sending out applications. It will take time to find a new job and I have made a vertical career step so it is time for another horizontal move. The mixed emotions of this having the potential to make me hit financial jackpot due to stock options are preventing me from fully devoting my time to find something new as well as my teams being such excellent and wonderful people to work with every day. It is hard, very hard to make that very final decision and I am very clearly not yet there.

For the previous summary please visit Summary of January 2018 and here you can see my stock portfolio as it is.

Invested versus Current February 2018

The total invested value is now up at: 109,855 €. During the month of February I decided to pick up more of the falling dagger H&M as well as ETF Oil which was not a falling dagger but very quickly became one.

Current investments in February 2018

The value of the portfolio is today: 113,333 € and spread out I now have around 5,652 € in cash on the different accounts. I have a realised gain of 2,857 € and the combined realised and unrealised gain is now at: 3,478 € (3%) which is not good at all but the entire market has dropped so not much to do about it unless one attempts to time the market movements which I do not.

Me versus DAX during February 2018

DAX dropped down a little during the month to 11,914 points which means that the it decreased by -6.8% which is worse than my portfolios drop of "only" -6.2%.

Conclusion: It is probably a good moment to go shopping and I hope that the investments that I made in February will turn out to be ok over time. Both, very large, investments that I made in February continued down after I had bought them which no one will be surprised about. My portfolio decreased slightly less than DAX, which is good, but it is a marathon and not a sprint as we all know. 

Saturday, 3 March 2018

Dividend from DBAG, Intel and ETF Russia: February 2018

Logo of DBAG 2018

For my 100 shares in DBAG I received 140 € in dividends. From this was taken 35 € in taxes and I was left with 105 € in cash on my broker account.

To find out more about DBAG then please click here.


Logo of Intel 2018


For my 100 shares in Intel I received 33.15 € in dividends. From this was taken 4.98 € in taxes and I was left with 28.17 € in cash on my broker account.

To find out more about Intel then please click here.


Logo of HSBC 2018


For my 270 parts in ETF Russia I received 64.88 € in dividends. No taxes were paid and all of it was paid into my broker account as cash.

To find out more about ETF Russia then please click here.

To see my total dividend flow then please visit the Stock Dividends page that has now been updated.