Monday 30 April 2018

Analysis of Talanx 2018


Logo of Talanx 2018

Company: Talanx 

ISIN DE000TLX1005 | WKN TLX100 

Business: A German mutual holding insurance company. It is divided into five divisions: Industrial Lines (covering all the insurance needs of industrial companies), Retail Germany (retail and commercial customers covering property/casualty), Retail International (outside of Germany), Reinsurance (non-life reinsurance via especially Hannover Rückversicherung that Talanx own to 50.2%) and finally Financial Services (an internal reinsurance part for the entire group). 

Active: In over 150 countries.

P/E: 13.7

Here you can find the previous analysis of Talanx 2017

Contrarian analysis of Talanx 2018 with P/E, P/B, ROE as well as dividend.

The P/E of Talanx is looking ok with 13.7 and the P/B is also great with 1.0 which gives us a go from Graham. The earnings to sales are very low with only 2% and the is awful with 7.6%. The book to debt ratio is ok with 0.7.
In the last five year they have had a yearly "revenue" growth rate of 3.5% which corresponds to a motivated P/E of 12 to 15 which means that Talanx is today fairly valued by the market.
They pay an acceptable dividend of 3.8% which correspond to 53% of their earnings so a bit on the higher side of things.

Conclusion: Graham says yes and I say hold. P/E, P/B and dividend look good but the ROE is simply not good enough. Without the end of year natural disasters 2017 could have been a great year but now it was not and there is no guarantee that 2018 will not be hit by major disasters. In my opinion one should buy insurance companies when they are severely pushed down and Talanx is today not there but are instead fairly valued. I will hold on to the shares I have but I will not increase my holding.

Sunday 29 April 2018

Talanx annual report 2017


Front page of Talanx 2017 annual report

The report in full you can find here, to read my previous annual summary then click on Talanx annual report 2016 and to find out more regarding Talanx then go to analysis of Talanx 2017.

This year we can directly see the dangers of insurance companies. Up until August everything was looking very good for Talanx and they expected to get a wonderful profit by the end of the year but then they were hit with massive claims from Harvey, Irma and Maria as well as two earthquakes in Mexico. Due to these things the year went from being a success to being poor.
In the income statement below we see that they made a nice increase in Gross written premiums from 31 to 33 billion € but the earnings went from 1.6 down to 1.3 billion €. What annoy me the most is that they have started to complain which is only done to divert the blame. Pathetic! So starting with natural disasters, interest rates, US tax regulation, competition as well as BREXIT. I am neither amused nor am I impressed.


Income statement of Talanx 2017


Conclusion: Talanx have become as whining as they previously were in MüRe before I stepped out. Since I have not seen crook behaviour here of talking down the share price before the CEO buys a massive amount of shares I will leave it as it is. I will remain as shareholder but must keep a closer eye on Talanx from now on.

Saturday 28 April 2018

Analysis of RWE 2018


Logo of RWE 2018


Company: RWE 

ISIN DE0007037129 | WKN 703712 

Business: A German electricity and gas company. RWE currently have three pillars that it stands on: Conventional Power Generation (production of electricity, gas and oil), Energy Trading (buying and selling of electricity, gas and oil) and finally Innogyn (subsidiary, the green energy daughter).

Active: Europe mainly.

P/E: 6.9

Here you can find the previous analysis of RWE 2017

Contrarian analysis of RWE 2018 with P/E, P/B, ROE as well as dividend.

The P/E is looking good with 6.9 as does the P/B with 1.9 which means that Graham gives the green light on this one. The earnings to sales are not impressive with 4% but it is nothing strange for the field and the ROE is excellent with 28% but I would claim that comes from the high debt leveraging. The book to debt ratio is horrible with 0.12 which is in the region of banks.
In the last five years they have seen a yearly decrease in revenue in the size of -3.8% which is very bad and this then gives us a motivated P/E of around 8 which means they are fairly valued by the market today.
They try to invest some money into R&D in the size of 10% which I find to be ok.
If passed on the shareholders meeting then they will pay out a special dividend of one extra € to the normal payment of 0.5 € which gives us dividend of 7% which is excellent and this would be 48% of their earnings so fully acceptable also in that sense. The reason for the extra dividends in the nuclear taxes that came back and that the common shares have not received a dividend for the last two years.

Conclusion: Graham says yes but I am cautious. The P/E and P/B is good, the ROE also as is the dividend this year at least. However due to the deal with E.On it is a big question mark on the horizon and I would like to see what comes out of that before it is worth to look into any further investments. I will remain as a shareholder but I will not increase my position.

Friday 27 April 2018

RWE annual report 2017


Front page of RWE annual 2017 report

To read the report in full please go here, to see the previous summary then click on RWE annual report 2016 and to see the previous analysis of RWE 2017.

As can be seen in the income statement below for RWE the year of 2017 turned out to be a pretty good one. The revenue was down by around 1 billion EUR but the earnings had turned from a massive loss of 5.7 billion last year to 1.9 billion in earnings this year. What was a bit worrying in the report was that they predict continued revenue and earnings decreases during the coming years and that the "big" turn will not be until 2020. The interesting thing is that this was based on status quo and did not consider the massive deal that they have now done with E.On so it will be highly interesting to see how this deal will influence future revenues as well as earnings.


Income statement of RWE 2017


Conclusion: The German energy market is going thru a massive change, which was not mentioned in this report, and as a shareholder I look forward to owning two companies that are highly specialised in their independent fields. So I will remain as a shareholder for now and will keep an eye on that the oil giants have started to step into the field of more green energy production.

Thursday 26 April 2018

Analysis of Nike 2018


Logo of Nike 2018

Company: Nike

Business: An American company that are selling and developing athletic footwear, apparel, equipment and accessories. They have several brands: Nike, Nike+, Hurley, Jordan Brand and Converse.

Active: They are present world wide and they are known world wide by name and symbol.

P/E: 25.6

For a previous analysis please click on analysis of Nike 2017.

Contrarian analysis of Nike 2018 with P/E, P/B, ROE as well as dividend.

The P/E of Nike is very high with 25.6 and so is the P/B with 8.8 which gives a clear no go from Graham. Earnings to sales are ok with 12% and the ROE is excellent with 34.2%. The book to debt ratio is full ok with 1.1.
In the last five years they have had a yearly revenue growth rate of 6.3% which is excellent and this gives us a motivated P/E of 19 to 21 which means that the market is currently overvaluing Nike.
They pay a tiny dividend of 1% which happily only correspond to 27% of their earnings so they should be able to keep it up.

Conclusion: Graham says no and so do I. The P/E and P/B is too high, the ROE is great but the dividend is meaningless. I will remain as a shareholder fully knowing that next year will be a tough one due to the taxes but I will not increase my position any further.

Wednesday 25 April 2018

Nike annual report 2017


Front page of Nike 2017 annual report

To view the report in full please go here and to find out more about the previous year then please visit Nike annual report 2016 and for the analysis of Nike then please click on analysis of Nike 2017

Due to Nike running a broken year I am far behind in the reporting. Looking at the Q3 2018 which they have filed, they are also taking a massive tax hit which is over 70% and leads to a significant decrease in earnings. Anyway... if we look at the financial statement below then we see that Nike managed to increase their revenue from 32 to 34 billion USD and they managed to increase their earnings from 3.8 to 4.2 billion USD which is an excellent result! They had in the end of their broken 2017 year bought back shares to a value of 4.4 billion USD which leaves around 7.5 billion left for buying back shares.


Financial statement of Nike 2017


Conclusion: 2017 was a good year for Nike. From what we can see 2018 will be far from as good as 2017 due to taxes but also due to a decreased growth rate in their revenue and ultimately earnings. I will remain as a shareholder well aware of what is coming.

Tuesday 24 April 2018

Stock bought April: ETF Russia


Logo of HSBC the holder of ETF Russia

As some of you might have noticed I have started to push in more money into ETFs than what I have ever previously done. By the look of it I am still doing that in a contrarian fashion for good and bad. Now that there have been hard words from May as well as from Trump the Russian index dropped down significantly (around -20%) and this at a time when the oil price keeps climbing. The Russian economy is very strongly connected with their oil and gas reserves and for this very reason I have no fear.

I therefore pushed up my investment by buying an additional 280 parts. Including fees I spent 2273.3 € and in total I now own 550 parts in ETF Russia at a total value of 4217 €.

To take a look at my current Stock Portfolio then please click on the link. The portfolio will however not be fully updated until the end of the month.

Analysis of Intel 2018


Company: Intel 

ISIN US4581401001 | WKN 855681 

Business: An American hardware producer (mainly processor). The segments that they present are: Client Computing Group, Data Center Group, Internet of Things Group, Non-Volatile Memory Solutions Group and finally Programmable Solutions Group.

Active: Products are sold world wide. 

P/E: 25.2

To find out more concerning Intel then please go to analysis of Intel 2017.

Contrarian analysis of Intel 2018 with P/E, P/B, ROE as well as dividend.

The P/E of Intel is pretty high with 25.2 as is the P/B with 3.5 which means that the company would be of no interest to Graham. The earnings to sales are ok with 15% but the ROE is on the low side with only 13.9%. The book to debt ratio is however good with 1.3.
In the last five years they have managed to have a yearly revenue growth rate of 3.6% which I find acceptable and this gives us a motivated P/E of between 13 to 16. This means that Intel is overvalued by the stock market today however without the large tax then they would have fallen within this region.
To stay on top of things they spend a lot of money on R&D to the size of almost 140% of their earnings which I find to be a lot but at the same time gives assurance that they will catch up to or even surpass their competitors.
They pay a small dividend of 2.1% which correspond to 53% of their earnings which I find acceptable once again considering the tax payment.

Conclusion: Graham says no and so do I. The P/E and P&B is too high, the ROE too low as is the dividends. I will remain as a shareholder but I consider Intel to be fairly valued at the moment and I will not increase my holding.

Monday 23 April 2018

Intel annual report 2017


Front page of Intel annual 2017 report

To view the report in full please click here and for my previous summary please see the Intel annual report 2016 and to find out more concerning Intel then please go to analysis of Intel 2017.

In the financial statement below we see that Intel had an excellent year that was held back by a significant tax payment. They increased the revenue from 59 billions to almost 63 billion USD which is excellent. However the bottom line is not looking so good since they ended up with a 52% tax rate which left in the end of the year 9.6 billion in earnings compared to 10.3 billion last year. They claim in the report that this was a one-off payment and that the tax rate moving forward in 2018 will be lower compared to what they have been paying. This means that 2018 has truly the potential to become an excellent year for Intel!


Income statement of Intel 2017


Conclusion: Without the massive tax Intel would have had an excellent year already in 2017 but now that will be pushed forward until 2018, if they continue in the same fashion, which I hope that they will. Intel has been and still are a good investment and I will remain as a shareholder.

Sunday 22 April 2018

Analysis of IBM 2018


Logo of IBM 2018

Company: IBM

ISIN US4592001014 | WKN 851399

Business: An American IT service company. They are currently standing on six pillars and each year they are shifting things around and start reporting new areas. 

Active: World wide making sales in over 170 countries.

P/E: 25.5

To find out more regarding IBM then please click on analysis of IBM 2017.

Contrarian analysis of IBM 2018 with P/E, P/B, ROE as well as dividend.

The P/E for IBM is far too high with 25.5 and the P/B is equally bad with 8.4 which gives a clear no go from Graham. Earnings to sales I find very low with 7% for a, mainly, service company and the ROE is excellent with almost 33% but that is more due to large debt than anything else. The book to debt ratio is at 0.16 which is also very low.
In the last five years they have had a decreasing yearly revenue of -4.5% which gives us a motivated P/E of around 8 which means that they are overvalued by the market.
They spend a lot of money on R&D especially considering that over 100% of their earnings went into it which one at some point would hope would lead to something but they have done this for years without, by the look of it, anything much coming out of it.
They pay a good dividend of 3.8% which is not so great considering that it corresponds to 96% of their earnings. Should it really have been increased this year?

Conclusion: Graham says no and so do I. Last year I thought the turning point was there but obviously that was not the case. The P/E is one step worse, due to tax, while the P/B has improved slightly but it is still far from reasonable levels. Dividends are good but not sustainable in the long run unless there will actually be some form of increase in earnings. I will remain as a grumpy shareholder.

Saturday 21 April 2018

IBM annual report 2017


Front page of IBM 2017

For the report in full please go here, for the previous summary please see IBM annual report 2016 and to find out more regarding IBM then please click on analysis of IBM 2017.

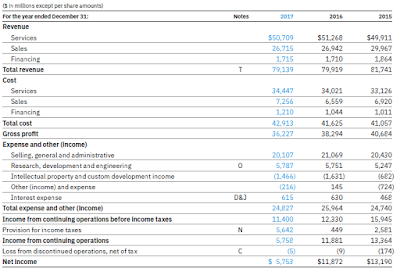
Looking at the financial statement below then the drought continues with an added on tax effect on top of that. So once again they had almost 80 billion USD in revenue but instead of getting around 10 billion USD out in profit they ended up with only 5.7 billion USD. Rometty, Rometty, Rometty when shall you manage to show a year of growth with increasing margins and not only shrinkage of everything as you have as of yet provided us shareholders with?


Income statement of IBM 2017


Conclusion: I have now been a shareholder in IBM for four years. It would be a considered as a long time for many but for me it is not. More than half of my investments were made in 2014 or before. I still believe that IBM can turn this around but it is also very clear that the more years that passes the higher the increase they must show for me to reach an acceptable ROI. I have now, unfortunately, turned into a grumpy shareholder in IBM.

Friday 20 April 2018

Analysis of HM 2018


Logo of H&M 2018


Company: H&M

ISIN SE0000106270 | WKN 872318

Business: Fashion retail with H&M, & Other Stories, Cheap Monday, COS, Monki, Weekday and Arket. The currently have online offerings in 43 of their markets.

Active: They have over 4700 stores in 69 markets. They are pretty much half the size of Inditex which shows us how large they can become. The main markets are in Europe where they are well established but also in North America. They have few stores in South America, Asia, Middle East and Africa.

P/E: 13.8

For the previous analysis please see Analysis of HM 2017.

Contrarian analysis of H&M 2018 with P/E, P/B, ROE as well as dividend.

The P/E is very reasonable with 13.8 but the P/B is too high with 3.8 which gives it a no go from Graham. The earnings to sales are at 7% which should be higher but the ROE is excellent with 27% and so is the book to debt ratio with 1.3.
In the last five years they have seen a yearly revenue growth rate of almost 9.1% which is excellent and this leaves us with a motivated P/E between 19 to 24 which means that the market is undervaluing H&M at the moment.
They pay an excellent dividend (paid out in two portions per year) in the size of 7.2% which on the down side corresponds to pretty much 100% of their earnings. So they better increase the earnings or soon decrease their dividend payments.

Conclusion: Graham says no but I say yes. H&M is making money, the P/E, ROE and dividend is excellent but large risk for decreased dividend in the future. I will remain as a shareholder that have not yet allowed my self to go grumpy due to the short holding period even though I do regret stepping in too early in H&M.

Thursday 19 April 2018

HM annual report 2017


Front page HM annual 2017 report

For the report in full please go here no previous summary has been made due to it being an new investment and to find out more about H&M then please go to analysis of HM 2017.

As most of you already know 2017 was not a spectacular year for H&M. For a long time they have been considered to be one of the crown jewels in Sweden and that shine have decreased lately. I see the fears and worries for the future due to online, increased inventory, is the CEO skilled enough, over exploitation etc. For me H&M have indeed issues but, and to me this is a big but, they are still making money. Sometimes it sounds as if online sales such as Zalando is some "new" threat to H&M. Germany is H&Ms largest market. Zalando was started in Germany and have been around for many years now. This threat is not new I would even stretch myself to state that H&M getting their online business up and running is more of a threat to Zalando. They had that market pretty much to themselves for a long time and from now on H&M will start to take market shares back. I know for a fact that they had over exploitation in Germany that I hope will get sorted out now that focus is slightly removed from growth to actually looking over their costs.

That said 2017 was not a great year. They grew their revenue to 232 billion SEK and the earnings coming out in the end of that funnel was 16.2 billion SEK which was almost 2.5 billion less than last year. Yeah, that is not good.


Income statement of HM 2017


Conclusion: As the stupid contrarian investor that I am I decided to invest in H&M last December which turned out to be too early and then I pushed in more money during February after I had received my bonus. As with every investment I make I of course hope it will be successful. In this case I want to see that due to an additional two reasons: I want it to regain the crown jewel status of Sweden and I love their sustainability initiatives.

Wednesday 18 April 2018

Analysis of Hugo Boss 2018


Logo of Hugo Boss 2018

Company: Hugo Boss

Business: A German high-end fashion retailer and accessories for both men and women. They have several different brands: BOSS, BOSS Orange, BOSS Green, HUGO and finally HUGO BOSS. The brands consist of business wear, evening wear, shoes and leather accessories. They are also active with licensed fragrances, glasses, watches and other areas they consider to be able to make contributions to.

Active: Due to active marketing the Boss brand is well known in the world and they sell products in 127 countries world wide. Production is in Asia & Eastern Europe. They have more than 7,700 sale points.

P/E: 22.5

For the previous analysis please visit analysis of Hugo Boss 2017.

Contrarian analysis of Hugo Boss 2018 with P/E, P/B, ROE as well as dividend.

The P/E for Hugo Boss is high with 22.5 as is the P/B with 5.7 which means Graham would stay away. Earnings to sales is at 8% which is ok but I expect more from "luxury" brands. The ROE is very good with 25% as is the book to debt ratio of 1.1.
In the last five years that have had a yearly revenue growth rate of 2.4% which is a bit on the low side and this gives us a motivated P/E of 12 to 14 which means that Hugo Boss is overvalued by the market today.
They pay a very nice dividend of 3.6% which correspond to around 80% of their earnings which is in the higher bracket of what they want to pay out (60 to 80%) and I would love to see this decrease slightly in the future due to increased earnings.

Conclusion: Graham say no and so do I. The P/E, P/B is far too high even though ROE and dividends are fully acceptable. I will remain as a shareholder.

Tuesday 17 April 2018

Hugo Boss annual report 2017

Front page of Hugo Boss 2017

For the report in full please click here and for the previous report then please visit Hugo Boss annual report 2016 and for an analysis then please visit analysis of Hugo Boss 2017.

If we take a look at the financial statement below then we see that they only had a minor increase in sales but due to less costs for for instance closing down unprofitable shops, which they did last year, they managed to increase the profits nicely from 194 to 231 million €. I would of course have loved to see an even larger jump but it is ok.

Income statement of Hugo Boss 2017

Conclusion: Hugo Boss is doing ok. They need to push up their earnings one tick next year but I see no reason for worries at this stage. It was supposed to be a very short investment that are now extending. I will remain as a shareholder.

Monday 16 April 2018

Analysis of Fugro 2018


Logo of Fugro 2017


Company: Fugro 

ISIN NL0000352565 | WKN A0ET3V 

Business: A Dutch geotechnology company. They still have their four subunits: Geotechnical (resolve geotechnical problems offshore, nearshore and onshore), Survey (all kind of offshore and geospatial surveys for the development of oil and gas platforms), Subsea Services (repair, construction etc.) and Geoscience (seismic and seabed databases for the exploration of new projects). 

Active: World wide in 60 countries. 

P/E: -5.9

Here you can find the previous analysis of Fugro 2017.

Contrarian analysis of Fugro 2018 with P/E, P/B, ROE as well as dividend.

The P/E for Fugro is negative -5.9 due to losses but the P/B is however good with 1.3 still it gives a clear no go from Graham. The earnings to sales as well as the ROE is, of course, also negative and the book to debt ratio is at 0.62. They are burning their retained earnings from the golden years.
In the last 5 years they have had a negative yearly revenue decrease of -9.2% which is awful and this therefore give us a motivated P/E of around 8 which means that the market may be overvaluing Fugro.
They pay, since a long time now, no dividends which I find utterly wise.

Conclusion: Graham say no and so do I. The only good thing is the P/B value and that is by far not enough for making an investment. We would need to see a turn before any more money is invested into Fugro and clearly we are not yet there... if ever. I remain a grumpy shareholder. How I wish that I would not be forced to write that all the time.

Sunday 15 April 2018

Fugro annual report 2017


Front page of Fugro 2017

For the report in full please go here and to see my previous summary then visit Fugro annual report 2016 and to find out more about Fugro then please click on analysis of Fugro 2017.

Another year another sorrow. The revenue kept dropping again down from 1.8 billion to 1.5 billion €. For the fourth year in a row they made a loss and they keep eating large chunks from their retained earnings. This is of course not sustainable and by the look of it the increase in oil price have not yet started to provide Fugro with any extra money. In the BP report I read that they have had a very successful year in terms of finding new, especially, gas deposits. This is obviously not being performed by Fugro. The backlog has dropped down even one step further from last year which to me means that they have to be even more desperate during their price negotiations during the coming year to get any form of income.


Income statement of Fugro 2017


Conclusion: I see still not a turning point for Fugro and what is worse I only see their situation continuing downhill. As the fool I was when I made the investment thought it would be a short slope with quickly regained earnings and, followed on that, nice juicy dividend payments once again. I remain a grumpy shareholder.

Saturday 14 April 2018

Analysis of E.On 2018


Logo of E.On 2018


Company: E.On 

ISIN DE000ENAG999 | WKN ENAG99 

Business: A German energy provider and electricity producer. They are still claiming to have ten different business areas: Renewable Energy, Conventional Generation, Energy Efficiency, Exploration & Production, Gas Supply, Gas Storage & Transport, Trading, Distribution, Sales and finally Technical Services.

Active: They are present in several countries in Europe as well as in Russia and in Brazil. 

P/E: 5.0

Here you can find the previous analysis of E.On. 2017

Contrarian analysis of E.On 2018 with P/E, P/B, ROE as well as dividend.

The P/E of E.On is looking excellent with 5.0 but the P/B is slightly off the chart with 4.9 which still gives a no go from Graham. The earnings to sales are excellent with 10% and the ROE is insane, due to high debt leverage, with 98%. The book to debt ratio is very low with only 0.08.
In the last three years they have had a negative yearly growth rate of -3.9% this gives us a motivated P/E of around 8 which would mean that E.On is undervalued by the market right now.
They pay an acceptable dividend of 3.4% which corresponds to almost 17% of the earnings so there would have been room to increase it if they would not have decided for the RWE deal.

Conclusion: Graham says no but I am more excited. If E.On can manage to push up their earnings nicely with the new investment then they will have a bright future. The P/B is however looking bad but the dividends is ok. I will remain a grumpy, but as I mentioned yesterday, a hopeful shareholder.

Friday 13 April 2018

E.On annual report 2017


Front page E.On. annual report 2017

For the report in full please go here and to see my previous summary please visit E.On annual report 2016 and to find out more about E.On then please go to analysis of E.On 2017.

Interesting developments in the German market. E.On will buy Innogy from RWE and pass over some of their assets to RWE. This is big. One goes for the net and the other one for electrical generation. Very interesting.

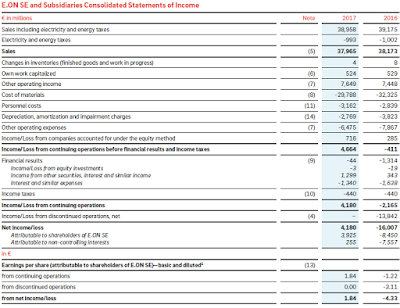
This year E.On actually managed to make some money as can be seen in the income statement below. A large chunk of it and some directly goes to buying the majority shares Innogy. This year they had a profit of 3.9 billion € compared to last year with a loss of -8.5 billion €. The large reason for this profit comes from lowered material costs as well as cutting expenses.

Income statement of E.On 2017

Conclusion: I must say that I feel excited about the deal between E.On and RWE. Two companies that I own, both with a mixture of it all, is now refining their strategies and hopefully this will lead to even stronger cost cuttings. On top of this they also increased their dividend payment compared to last year but of course it is not at the 50% that they locked down two years ago... so that pretty much lasted 0 years. I will remain grumpy shareholder but with a small amount of hope for the future.

Thursday 12 April 2018

Analysis of DB 2018


Logo of DB 2018


Company: Deutsche Bank 

ISIN DE0005140008 | WKN 514000

Business: A German investment bank. They have five products and services pillars: Private & Business Clients (classical banking services: accounts, deposits, loans, pensions products), Asset & Wealth Management (helps institutions and wealthy individuals to increase their wealth across all asset classes), Corporate Banking & Security (sales, trading etc of financial products such as equity, bonds etc. as well as dealing with mergers and acquisitions), Global Transaction Banking (world wide banking services and products for corporate and institutions) and finally None-Core Operations Unit (dirty laundry).

Active: in 70 countries world wide.

P/E: -31.5

Here you can find the previous analysis of DB 2017.

Contrarian analysis of DB 2018 with P/E, P/B, ROE as well as dividend

The P/E for DB is negative with -31.5, which is horrible, while the P/B is very good with 0.4. The end result is still the same because Graham says no to this one. Earnings to sales and the ROE is negative and being a bank the book to debt ratio is low with only 0.04.
In the last five years they have had a yearly decrease in interest income by -0.8% and this gives us a motivated P/E of around 8 which means that DB is most likely overvalued by the market.
They pay a meaningless dividend of 1%, please stop it, which correspond to a negative value due to their losses.

Conclusion: Graham says no and also I have to say no. Not because the bank, based on P/B, looks expensive but simply due to that I cannot plough any more money into DB. I will remain a grumpy shareholder.