Friday, 9 June 2017

Uniper analysis 2017


Logo of Uniper 2017


Company: Uniper

ISIN DE000UNSE018 | WKN UNSE01

Business: A German energy company. They are standing on three pillars: European Generation (from all kind of sources), Global Commodities (energy trading) and finally International Power Generation (Russia and Brazil).

Active: Europe, Russia and Brazil

P/E: -3.2
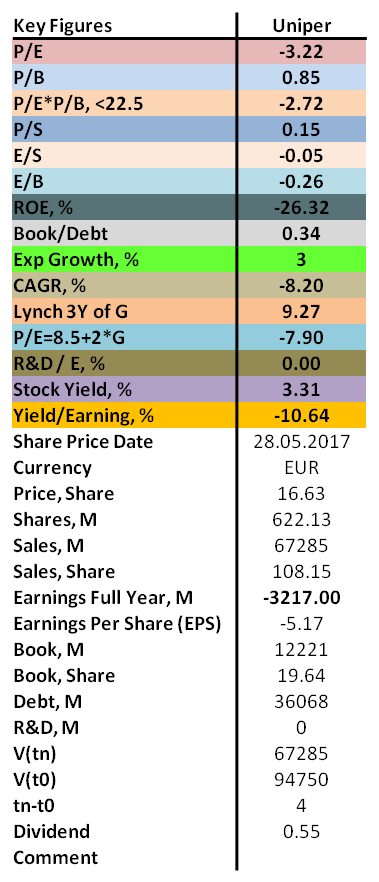
Contrarian analysis of Uniper 2017


The P/E of Uniper is awful with -3.2 due to losses but the P/B is looking ok with 0.9 which in the end still gives a no from Graham. The earnings to sales and ROE are meaningless due to the losses but the book to debt ratio is down at 0.3 which is low but not unusual.
In the last four years they have had a negative yearly revenue growth in the size of -8.2% which gives us a motivated P/E of 8 and Uniper is overvalued by the market today.
Insanely enough they pay a dividend in the size of 3.3% which in my book should never be done when you are showing losses. 

Conclusion: Uniper is showing a difficult year followed by a difficult year followed by a... If one goes back in their "history" then they have made  losses for the last four years. Not a good sign. Graham says no to this and so do I. I want to see some actual results and not only an increasing share price to make me happy and to make me even consider buying more shares. I will remain as a shareholder though.

Thursday, 8 June 2017

Uniper annual report 2016


Front page of Uniper 2016 annual report


To read the report in full then please go here. The only previous report to look back at would be the summary of Q2 2016 and I have still not managed to make an analysis of the company.

From the financial statement below we can see that Uniper is not having a good time. The revenue dropped by almost -30% going from 92 bn € to 68 bn € and the earnings, well earnings is the wrong word, or I mean the losses have remained well over -3 billion € for this year as well as the previous. Any lights in the end of that tunnel? The share price keeps going up so the investors must tend to think so.


Financial statement Uniper 2016


Conclusion: Uniper is having a hard time and they will really need increased energy prices to improve their situation. I received shares in this company as a gift and I will keep my gift for now so I will remain as a shareholder in Uniper.

Wednesday, 7 June 2017

Analysis of TJX 2017


Logo of TJX 2017

Company: TJX 

ISIN US8725401090 | WKN 854854 

Business: An American off-price apparel and home fashions retailer. They use several store names based on take overs and store concept and in the U.S. they have T.J. Maxx, Marshalls, HomeGoods, Sierra Trading Post and in Canada they have Winners, HomeSense, Marshalls and in Europe they got T.K. Maxx and HomeSense. 

Active: in the US, Canada, the Netherlands, Germany, the UK, Poland, Ireland and Austria.

P/E: 21.6

Here you can find the previous analysis of TJX 2016. 


Contrarian analysis of TJX 2017

The P/E of TJX is far too high for my liking with 21.6 and the P/B is horrible with over 10 which gives a very clear no from Graham. Earnings to sales seems reasonable with 7% and the ROE is spectacular with over 50%. The book to debt ratio is so, so with 0.5.
In the last five years they have shown a yearly revenue growth rate of 5.1% which is excellent and this then gives us a motivated P/E of 16 to 19 which means that TJX is today slightly overvalued by the market.
They pay a silly dividend in the size of 1.4% which on the good side only correspond to 30% of their earnings so there is room for improvement.

Conclusion: Graham says very clearly no to TJX and I also find it to be too expensive. The P/E is high and so is the P/B with a silly dividend. The only very good one is the ROE value. All this said I will neither sell my shares nor will I buy more so I will remain as a shareholder.

Tuesday, 6 June 2017

TJX annual report 2016


Front page of the annual 2016 report from TJX

To read the report in full please go here, for my previous summary please visit TJX annual report 2016 and to find out more about TJX then please click on analysis of TJX 2016.

In the financial table below we can see that TJX is doing pretty ok. The revenue increased yet again and this time by a bit over 7% which is good. The costs have however increased much more which leaves us pretty much flat compared to 2015 which I do not like that much. The only reason why things looks good when one compares EPS is due to that they are buying back shares.


Financial statement of TJX 2016


Conclusion: Revenue and expansion wise TJX is doing very well. When it comes to bringing home more earnings then they are not doing equally well. Still... it costs money to expand your business and TJX are expanding like crazy so I am fine with this and I will remain as a shareholder to see them crack the 40 billion USD revenue as they have promised to do.

Monday, 5 June 2017

Analysis of Talanx 2017


Logo of Talanx 2017

Company: Talanx 

ISIN DE000TLX1005 | WKN TLX100 

Business: A German mutual holding insurance company. It is divided into five divisions: Industrial Lines (covering all the insurance needs of industrial companies), Retail Germany (retail and commercial customers covering property/casualty), Retail International (outside of Germany), Reinsurance (non-life reinsurance via especially Hannover Rückversicherung that Talanx own to 50.2%) and finally Financial Services (an internal reinsurance part for the entire group). 

Active: In over 150 countries.

P/E: 9.2

Here you can find the previous analysis of Talanx 2016. 


Contrarian analysis of Talanx 2017


The P/E of Talanx is excellent with 9.2 and so is the P/B with 0.9 which gives us a clear buy signal from Graham. Earnings to sales are not so impressive with only 4% and the ROE is also not very exciting with only 10% but the book to debt ratio is looking ok with 0.7. They have changed their book keeping there slightly and they no longer calculate their float of 110 billion € as a liability. I am not able to say if this is a correct approach or not.
In the last five years they have shown a yearly increasing revenue growth rate of 3.2% which is good and this then gives us a motivated P/E of 14 to 16 which means that Talanx is today undervalued by the market.
They pay a very nice dividend in the size of 4.1% which represents 37% of their earnings so there is space to increase it.

Conclusion: Graham says yes to Talanx and so do I. The P/E and P/B is great and so is the dividend. Due to that the P/B is still below 1 it makes sense to invest in Talanx and when it goes higher then that interest is gone. Personally I will not buy any more shares but I will remain as a shareholder.