Company: TJX
ISIN US8725401090 | WKN 854854
Business: An American off-price apparel and home fashions retailer. They use several store names based on take overs and store concept and in the U.S. they have T.J. Maxx, Marshalls, HomeGoods, Sierra Trading Post and in Canada they have Winners, HomeSense, Marshalls and in Europe they got T.K. Maxx and HomeSense.
Active: in the US, Canada, the Netherlands, Germany, the UK, Poland, Ireland Austria and Australia.
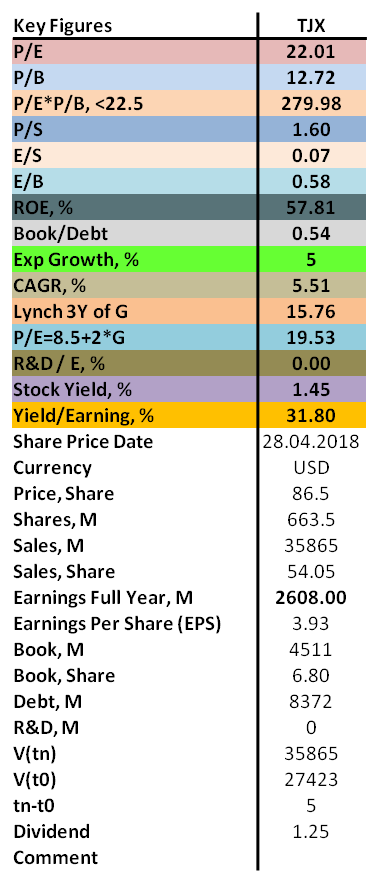
P/E: 22.0
The P/E of TJX is a bit on the high side with 22.0 and the P/B is extremely high with 12.7 which gives a clear no go from Graham. The earnings to sales are so, so with 7% and the ROE is excellent with 58% but due to debt leverage. The book to debt ratio is low with 0.6.
In the last five years they have shown an impressive yearly revenue growth rate of 5.5% which then also gives us a motivated P/E of 16 to 20 which means that TJX is today slightly overvalued by the market.
They pay a silly dividend in the size of 1.45% which corresponds to 32% of their earnings so it should be easy to maintain as well as increase in the future.
Conclusion: Graham says no and so do I. Today they are simply fairly valued by the market but on the other hand they are not so overvalued that it is worth to cash in on the investment and therefore I will remain as a shareholder.


No comments:
Post a Comment