Wednesday, 31 May 2017

K+S annual report 2016


Front page of the annual 2016 report from K+S

For the report in full please click here and for the previous summary please go to K+S annual report 2015 and to find out more about them then please click on analysis of K+S 2016.

When we take a look at the financial statement below then that is not a pleasant read. The revenue dropped by around -18% and this in a year when the Legacy project should have opened up the doors and started to generate a bit of revenue. Three issues were raised: Mild winter, low potash prices and Werra plant out of production. In the end they still managed to come out with a tiny profit of 0.9 € per share which means that they should have paid out 0.45 € per share but they decided to pay out even less with only 0.3 € per share.


Financial statement of K+S 2016


Conclusion: This year is the important year for K+S they need to show us the shareholders that the investment in Canada was worth the money. I think that they can do this. Each time I report something on K+S I remind myself of how I should have sold them when there was a price offered on them a long time ago. One way or the other as an investor one needs to build up a set of responses to do when certain situations appear. I very clearly know what to do in my next take over situation. I will remain as a grumpy shareholder for now.

Tuesday, 30 May 2017

Dividends from Deere, VW, Fast Retailing, K+S, Talanx, BASF, DB & Hugo Boss: May 2017

Sorry for the long title but plenty of companies have paid out dividends during the last month and since I no longer have so much time I just try to bunk them all together as much as possible.


Logo of Deere 2017

For my 30 shares I received 16.44 € in dividend. From this was taken 2.47 € in taxes and I was left with 13.97 € as cash on my broker account.

To find out more about Deere then please click here.


Logo of Volkswagen 2017

For my 12 shares in VW I received a total of 24.72 € in dividends. From this was taken 6.51 € in taxes and I was left with 18.21 € as cash on my broker account.

To find out more about VW then please click here.


Logo of Fast Retailing 2017


For my 6 shares in Fast Retailing I received a total of 8.47 €. From this was taken 1.30 € in taxes and I was left with 7.17 € as cash on my broker account.

To find out more about Fast Retailing then please click here.


Logo K+S in 2017


For my 240 shares in K+S I received in total 72 € in dividends (awful!). From this was taken 18.99 € in taxes and I was left with 53.01 € in cash on my broker account.

To find out more about K+S then please click here.


Logo of Talanx 2017


For my 80 shares in Talanx I received in total 108 € in dividends. From this was taken 28.48 € in taxes and I was left with 79.52 € as cash on my broker account.

To find out more about Talanx then please click here.


Logo of BASF 2017


From my 47 shares in BASF I received a total of 141 €. From this was taken 37.18 € in taxes and I was left with 103.82 € as cash on my broker account.

To find out more about BASF then please click here.


Logo of DB 2017


From my 420 shares in DB I received 79.80 € in dividends. From this was taken 21.04 in taxes and I was left with 58.76 € as cash on my broker account.

To find out more about DB then please click here.


Logo of Hugo Boss 2017


From my 35 shares I received 91 € and from this was taken 24 € in taxes which leaves me with 67 € as cash on my broker account.

To find out more about Hugo Boss then please click here.

To see my total dividend flow then please visit the Stock Dividends page that will soon be updated. It should be mentioned that this will not become a good year for dividends for me.

Monday, 29 May 2017

Analysis of Fugro 2017


Logo of Fugro 2017


Company: Fugro 

ISIN NL0000352565 | WKN A0ET3V 

Business: A Dutch geotechnology company. They still have their four subunits: Geotechnical (resolve geotechnical problems offshore, nearshore and onshore), Survey (all kind of offshore and geospatial surveys for the development of oil and gas platforms), Subsea Services (repair, construction etc.) and Geoscience (seismic and seabed databases for the exploration of new projects). 

Active: World wide in 60 countries. 

P/E: -3.7

Here you can find the previous analysis of Fugro 2016.


Contrarian analysis of Fugro 2017

The P/E of Fugro is horrible due to losses with -3.7 but the P/B is pretty ok with 1.2 still due to the losses it is a no go for Graham.
Earnings to sales and ROE makes little sense due to the losses but the book to debt ratio is at 0.8 which is ok.
In the last five years they have shown a yearly negative revenue growth rate of -3.9% which is awful and this then gives a modified P/E of around 8 which means that Fugro is overvalued on the market today.
They do not pay out a dividend so at least that is something that I like to see when a company is making losses.

Conclusion: Graham says no to Fugro and so do I since I still do not see a turn around happening. Due to the latest share price drop I tried to figure out if their "competitor" that bought up a lot of shares have decided to step away from Fugro again but I did not find any information in that direction. Anyway.. Fugro need to show one or two good quarters before it will be of interest to invest in it. I will remain as a grumpy shareholder.

Sunday, 28 May 2017

Fugro annual report 2016


Front page of the annual 2016 report from Fugro


For the report in full please go here and to see my previous summary then visit Fugro annual report 2016 and to find out more about Fugro then please click on analysis of Fugro 2016.

In the financial statement below it becomes very clear that the struggle for Fugro is not yet over. Revenue was down by almost -25% to 1.8 billion €. Their backlog keep decreasing year after year as do the equity that was built up from retained earnings. For the full year they reported a loss in the size of 300 million €.


Financial statement for Fugro 2016


Conclusion: The tough life continues for Fugro even though the energy companies have started to show some positive values. To me the question becomes how long behind the service companies will be lagging and have some of them started to throw in the towels? I will remain a grumpy shareholder.

Saturday, 27 May 2017

Analysis of Enel 2017


Logo of Enel 2017


Company: Enel 

ISIN IT0003128367 | WKN 928624 

Business: An Italian energy and gas company. They have hydroelectric, thermoelectric, nuclear, geothermal, wind, solar and other renewable power plants. They also have the network not only for electricity but also for gas pipelines in large parts of Italy. 

Active: Present in over 30 countries. Heaviest involvement in Italy and Iberia. 

P/E: 21.7

Here you can find the previous analysis of Enel 2016

Contrarian analysis of Enel 2017


The P/E of ENel is too high with 21.7 and the P/B is also on the high side with 1.3 which gives a no from Graham. The earnings to sales are so, so with 3% and the ROE is horrible with only 6.2%. The book to debt ratio is also not very nice with 0.4.
In the last five years they have had a negative yearly revenue growth of -3.6% which is bad and this then gives a motivated P/E of 8 which means that the stock market is highly overvaluing Enel at the moment.
They Pay a nice dividend in the size of 3.9% which on the other hand correspond to 83% of their earnings so they better start increasing those earnings.

Conclusion: Graham says no to Enel and so do I. The P/E, P/B is too high, the ROE is too low and the dividend %-age versus earnings are also poor! Enel did not have a bad year on top of this they are up at a P/E of 21 and yet one should not forget that energy prices for the last two to three years have been bad. I am thinking that maybe I should sell off my shares in Enel by the look of things... on the other hand... RWE, E.On. and Uniper had all losses and the result from Cez is not spectacular either so the fact that Enel is doing pretty good in these world market conditions is indeed impressive and it should be awarded by me remaining as a shareholder.

Friday, 26 May 2017

Enel annual report 2016


Front page of the annual 2016 report from Enel


For the report in full please click here and for the previous summary then visit Enel annual report 2016 and to get a better feeling for Enel then please take a look at analysis of Enel 2016.

In the financial statement below you can see that Enel is doing very well! Yes, their revenue did decrease slightly to 70 billion € but due to cost control they managed to get a decent earning out of 2.6 billion euro! The European energy market is very well connected. How can a company in Italy make significant profits while a German company makes significant losses? I would blame it all on the incompetent CEO. 


Financial statement of Enel 2016


Conclusion: Enel is doing an excellent job and each year they seem to increase their profits. I am very pleased with this investment and the only thing that saddens me is that I made such a small investment in Enel from the beginning.

Thursday, 25 May 2017

Analysis of E.On 2017


Logo of E.On 2017


Company: E.On 

ISIN DE000ENAG999 | WKN ENAG99 

Business: A German energy provider and electricity producer. They are still claiming to have ten different business areas: Renewable Energy, Conventional Generation, Energy Efficiency, Exploration & Production, Gas Supply, Gas Storage & Transport, Trading, Distribution, Sales and finally Technical Services. Uniper exists as a individual company but the separation has still not been completed and what they offer is (Power Generation, Global Commodities, Energy Storage, Energy Sales, Third Party Services and Engineering Services).

Active: They are present in several countries in Europe as well as in Russia and in Brazil. 

P/E: -2.1 (P/E5: also negative!) 

Here you can find the previous analysis of E.On. 2016

Contrarian analysis of E.On 2017

The P/E of E.On is awful due to losses and it is therefor -2.1. The book value is very fascinating with -14 which means that this company is pretty much dead. Graham shows no interest in this one. Earnings to sales and ROE shows sick values due to losses and negative equity and the same goes for the book to debt ratio.
In the last two years they have shown a yearly revenue loss of -5.5% which is horrible and it means that this should be valued pretty close to 0 which means that the stock market is strongly overvaluing E.On at the moment
Here comes the insane part! E.ON HAS NEGATIVE EQUITY AND YET THEY PAY A DIVIDEND! Please let me know if you have seen something sicker than this before. I complain when companies make a loss a year and how they should probably not be allowed to pay out dividends but this is one level higher on that sickness scale! A company having negative equity should never ever be allowed to pay out a dividend. The dividend is payed out in the size of 2.8%.

Conclusion: Graham says no. So do I. E.On and all its daughters are sick. The CEO needs to be removed. I need to rethink my position is this sick, sick company.

Wednesday, 24 May 2017

E.On annual report 2016


Front page of the annual 2016 report from E.On

For the report in full please go here and to see my previous summary please visit E.On annual report 2015 and to find out more about E.On then please go to analysis of E.On 2016.

In the financial statement below we can very clearly see how bad the situation is for E.On. Sales decreased with another -10% compared to last year and E.On made the spectacular loss of -16 billion €. MINUS SIXTEEN BILLION EURO! Well done guys, well done! What I love even more right now with E.On is that they even have negative equity. Great guys! Well done! Keep it up!


Financial statement of E.On 2016


Conclusion: E.On is pretty messed up to say it mildly. In my silly mind I expected either E.On or Uniper to be able to show a positive result after the split. Silly me. Both made huge losses as you will see when I get around to report on Uniper. The fantastic story with E.On is how long can a completely incompetent CEO still remain without getting fired? Is the answer really until he decides himself that it is time to leave? Can the German institutional shareholders really be that incompetent in their functions? By the look of it the answer is yes to that one. I will remain as an extremely grumpy shareholder cursing the day that I decided to step into the energy sector and to buy E.On.

Tuesday, 23 May 2017

DB analysis 2017


Logo of DB 2017


Company: Deutsche Bank 

ISIN DE0005140008 | WKN 514000

Business: A German investment bank. They have five products and services pillars: Private & Business Clients (classical banking services: accounts, deposits, loans, pensions products), Asset & Wealth Management (helps institutions and wealthy individuals to increase their wealth across all asset classes), Corporate Banking & Security (sales, trading etc of financial products such as equity, bonds etc. as well as dealing with mergers and acquisitions), Global Transaction Banking (world wide banking services and products for corporate and institutions) and finally None-Core Operations Unit (dirty laundry).

Active: in 70 countries world wide.

P/E: -5.2 (P/E5: also negative!)

Here you can find the previous analysis of DB 2016.

Contrarian analysis of DB 2017

The P/E is awful with -5.2 due to losses but the P/B is still very good with 0.6. No matter what, due to the losses, this is not a company for Graham. The earnings to sales are bad as is the ROE. The book to debt is scary low with 0.04 and Europe should never have allowed the European banks to leverage that much as they did and still do in some cases such as DB.
In the last five years they have had a negative yearly revenue growth rate of -4.5% which is awful and it gives us a motivated P/E of around 8. Due to the losses it is hard to tell where DB actually is but I would still say that they are overvalued by the market today.
On one hand they ask for more money from their shareholders and on the other hand they then pay out a dividend in the size of 1.1% which is, due to negative earnings, yet another burden on the balance sheer. Pathetic! There are moments when I think that it should be forbidden to pay out dividends if the company makes a loss. You as a shareholder will then have to be fully aware of this and invest accordingly.

Conclusion: Graham is not positive towards DB and neither am I. I strongly despise companies that ask for more money from their shareholder and then pay out dividends. Shameful behaviour! Yes, I understand that they did that to attract institutional investors but I do not care. Make it illegal. I will remain as a grumpy shareholder.

Monday, 22 May 2017

DB annual report 2016


Front page of the DB annual report 2016


The report in full you can find here and for my previous summary of the DB annual report 2015 then please click on that link and to find out more about DB then visit DB analysis 2016.

Last year they had a Cost/Income ratio of 115%. This year their C/I was 98%. In my world costs are what you have to pay and income is everything that you get coming in. By the look of it DB is calculating this slightly different since they managed to go -1.4 billion € for the full year which to me is not a positive value which 98% would indicate. They had an income of almost 26 billion € which should then mean an income of around 500 million € but alas no. The income has been pretty flat for the last four years and the costs are mainly low due to them having to pay for their latest criminal activities which ever latest popped up. Still last year DB lost around 6.8 billion € so we might go in the good direction. 


Financial statement of DB 2017


Conclusion: It is every shareholders hope that now that DB brought in some more capital that they actually manage to get back on the horse and that there will be no more discoveries... to my knowledge, in the pipeline, we still have Iran and Russian money laundry and then we have the much exciting Italian situation. Will that be the end of it? I unfortunately do not think so still... I will remain as a shareholder and as you know I did buy more shares in April.

Friday, 19 May 2017

Analysis of Coba 2017


Logo of Commerzbank 2017

Company: Commerzbank 

ISIN DE000CBK1001 | WKN CBK100 

Business: A German bank. Their five pillars are: Private Customers (accounts, credits, wealth management etc.), Mittelstandbank (medium sized companies as well as institutions), Central & Easter Europe (mBank big in Poland), Corporate & Markets (Corporate finance, equity, currencies etc.) and finally Non-Core Assets (Real Estate and ship-building). They actually only claim to have four pillars but I prefer to add their "bad bank", the NCA, as the fifth.

Active: Claim presence in 50 countries. Europe with Germany and Poland the biggest. 

P/E: 42.5

Here you can find the previous analysis of Coba 2016


Contrarian analysis of Coba 2017

The P/E of Coba is shockingly high with 42.5 which comes from very poor earnings but either way the P/B is very good with 0.4 which gives surprisingly enough a go from Graham. The earnings to sales a very poor with 3% and the ROE is laughable with 1%. The book to debt is as always very unpleasant which is normal for the German banks by the look of things.
In the last five years they have had the indecency of showing a yearly negative revenue growth rate of -7.5%. This is of course not good at all and it gives a motivated P/E of around 8 which means that Coba is today overvalued by the market.
They pay no dividends but on the other hand since they do not manage to bring in any earnings this is also how it should be.

Conclusion: Graham kind of says yes and I say grrr. I really thought that the turn around had started but that was clearly not the case. My patience for the German banks is very low at the moment. The only value looking ok is the P/B value and every other looks today very bad. It is interesting to see how fast things can go bad again. I will remain as a grumpy shareholder.

Thursday, 18 May 2017

Coba annual report 2016


Front page of the annual 2016 report from Coba

For the report in full then please click here and for the previous brief summary then please visit Coba annual report 2016 and to find out more about Commerzbank then please go to analysis of Coba 2016.

In the financial statement below we can see the same trend going on as it has done from the very first day that I bought Coba back in 2012. Less income, less income, less income. Everything just keeps going down year by year quarter by quarter. It is not a happy sight to see. Their Cost to Income ratio is up at 75.5%. Their earnings are silly low with only 279 million € coming out in the end which is the equivalent of 0.22 € per share. Last year they paid out 0.2 € in dividends and this year dividends have been cancelled again. To me this clearly shows that the managers do not even have a clue how far out on the scale of trouble Coba is. The capital ratios have improved ever so slightly but the facts remain that Coba is still not a healthy bank.


Financial statement of Coba 2016


Conclusion: Last year I thought that Coba had reached the turn around point which was part of the reason for why I pushed in some more money into it. Now we are back the the previous trend again and I do not see the turn around besides from in the share price that have improved significantly lately. I will remain a grumpy shareholder.

Wednesday, 17 May 2017

Analysis of Cez 2017


Logo of Cez 2017


Company: Cez 

ISIN CZ0005112300 | WKN 887832 

Business: A Czech electricity producer and distributor. They offer heat and gas to consumers and are active with telecommunications, informatics, nuclear research, planning, construction and maintenance of energy facilities, mining raw materials, and processing energy by-products. 

Active: Czech Republic, Poland, Bulgaria, Hungary, Slovakia, Romania and in Turkey. They wanted to step into Germany buy buying assets from Vattenfall but have currently taken a step back from that position.

P/E: 16.2

Here you can find the previous analysis of Cez 2016

Contrarian analysis of Cez 2017

The P/E is too high for my liking with 16.2 but the P/B is still good with 1.2 which gives us a go from Graham. The earnings to sales are ok with 7% but the ROE is awful with only 7.3%. The book to debt ratio is looking very good for an energy company with 0.6.
In the last five years they have had a negative yearly revenue growth rate of -0.8% which is pretty bad and this gives us a motivated P/E of 8 to 10 which means that Cez is today overvalued by the market.
They pay an excellent dividend in the size of 9.1% which correspond to almost 150% of their earnings so either they will soon have to stop these dividend payments or they need to shape up and bring in more earnings. I prefer the latter.

Conclusion: Graham says yes to Cez and I am not so happy with it. If it would not have been for the massive dividends that they pay out then I would probably have walked away even though P/E is so, so and the P/B is good. I will remain as grumpy shareholder.

Tuesday, 16 May 2017

Cez annual report 2016

Front page of the annual 2016 report from Cez

For the report in full please go here, to see the previous summary please visit Cez annual report 2015 and to find out more regarding Cez then click on analysis of Cez 2016.

As we can see in the table below Cez is on a slipping slope downwards and in the last two years they have not managed to bring in the money needed to pay out the dividend of 40 CZK per share that they have been doing for the last four years. The revenue dropped yet again compared to 2015 and very clearly they have not managed to balance that with decreased costs hence they only brought home 26.7 CZK per share. This is not a good result and they are spending a lot of money on maintenance of their plants and electrical network as well as being forced to write down assets especially in Turkey due to much less than expected profits being generated.


Financial statement for Cez 2016

It should also be stated that they are messing around with their reporting. They have previously reported the "group" and now they are doing a summary of that, see above, while in the IFRS regulated they only report the revenue and earnings for Cez. This means that they have reported all the revenue and earnings as being theirs while in reality they have only received a certain amount of those earnings paid back to them in dividends.

Conclusion: Cez is still not looking good and from my point of view they should not pay out dividends but I suspect that the government would not be pleased if they would not get their 40 CZK per share. I am not very happy with this investment but I will remain as a grumpy shareholder for now.

Monday, 15 May 2017

Analysis of BASF 2017


Logo of BASF 2017

Company: BASF

ISIN DE000BASF111 | WKN BASF11

Business: A German chemistry and polymer company. They are still active with five different business units and those are: Chemicals (with intermediates and polymers), Performance Products (pigments, care chemicals, health chemicals and paper chemicals), Functional Materials & Solutions (catalysts, construction chemicals and coatings), Agricultural Solutions (crop protection) and finally Oil & Gas (exploration and extraction).

Active: World wide and as they say themselves "in almost every country in the world". 

P/E: 20.3

For the previous analysis please see analysis of BASF 2016.


Contrarian analysis of BASF 2017


The P/E of BASF is far too high for me with 20.3 and the P/B is a little bit on the high side with 2.6 which gives a clear no go from Graham. Earnings to sales are reasonable at 7% but the ROE is a bit too low with only 12.8%. The book to debt ratio ends up at 0.7 which is ok.
In the last five years they have had an extremely poor revenue development with yearly -6% which is truly awful and this then gives us a motivated P/E of between 8 to 10 which means that BASF today is highly overvalued by the market.
They spend a nice chunk of money on R&D and I know for a fact that it is keeping them ahead of competitors so it is indeed worth those 45%.
They pay a decent dividend in the size of 3.4% which unfortunately correspond to almost 70% of their earnings which means that they better start bringing home some more money and soon!

Conclusion: Graham says no to BASF due to the high P/E, P/B and the poor ROE as well as the high percentage of paid out dividend. I own BASF today and I am more forgiving. They are indeed up at a high P/E and I would not buy them but they are not crazy high which would make it worth my while to sell them and they additionally have less than "common" earnings which leads to an inflated P/E value. I will remain as a shareholder in BASF.

Sunday, 14 May 2017

BASF annual report 2016

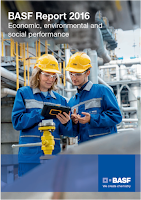
Front page of the annual 2016 report from BASF

I have a love/hate relationship to BASF. The "hate" started back in 2007 when I was refused a job with them due to that I completely crashed with the big boss of that department. As an old, old chemist he did not know about IUPAC rules for how to name compounds and as a wet behind the ears chemist I did not know the trade names of various compounds. It is just one of those moments in life when things went wrong. Already back then they had an extremely good hiring procedure and a lot of money was invested in trying to make sure that they hired the correct person but looking back they probably had one issue and that was that if the big boss says no then the person will not be hired. Today, in other professional companies, employees can get hired based on the HR department. Some bosses wants people that says yes and agree to everything they say but it is destructive for the company and hence HR should every now and then step in and make the decision when weak bosses are trying to have their way. One of my friends where hired like that via the HR but against the direct line manager and he have had the good fortune of having a splendid career which simply comes form him being excellent and people pushing careers often do not stay longer than 1 to 2 years in one place. Anyway...

After my incident with BASF I had a dislike towards them and their pompous employees / bosses. Afterwards in my career I ended up working with them and I must admit that I enjoy that. They are good and their slogan THE chemical company is correct. They do a lot of good stuff and they should be better known among people but it is hard when you are so focused on B2B sales.

For the report in full please go here and for the latest summary which was the BASF annual report 2015 then please click on that link and to find out more about The Chemical Company then please visit analysis of BASF 2015.

In the financial statement below we can see that they sales dropped like crazy! With a minus of almost 20% it is bad, bad news. The beautiful thing though is that A. they did not have a party and B. they managed to control their costs which leads to a fairly good earning at the bottom line. Sure compared to 2015 they are only up less than 2% in earnings but comparing that to the sales loss then it is pretty impressive! The earnings per share ended up at 4.3 € and they are paying out 3 € in dividends which means that they are confident in the future.


Financial statement of BASF 2016


Conclusion: BASF had another bad year which comes to a very large extent from their oil and gas business. last year they sold for well over 10 billion € and this year they were down at a bit over 2 billion €. A massive change! I might be wrong but to me that looks as if when they are not making any money they simply close the tap to keep the oil and gas until prices reach a more acceptbale level. If that is true then I personally fully agree with that behaviour. I will continue to be a shareholder in BASF.

Friday, 12 May 2017

Analysis of Hugo Boss 2017


Logo of Hugo Boss 2017

Company: Hugo Boss

Business: A German high-end fashion retailer and accessories for both men and women. They have several different brands: BOSS, BOSS Orange, BOSS Green, HUGO and finally HUGO BOSS. The brands consist of business wear, evening wear, shoes and leather accessories. They are also active with licensed fragrances, glasses, watches and other areas they consider to be able to make contributions to.

Active: Due to active marketing the Boss brand is well known in the world and they sell products in 127 countries world wide. Production is in Asia & Eastern Europe. They have more than 7,700 sale points.

P/E: 25.0

Contrarian analysis of Hugo Boss 2017

The P/E for Hugo Boss is very high with 25.0 and the P/B is also not very appealing with 5.5 which gives, as so often, a no go from Graham. The earnings to sales appear to be low with only 7%  but the ROE is great with over 20%. The book to debt ratio is good with 1.0.
In the last five years they have had a poor yearly growth rate of only 2.8% which then gives us a motivated P/E of 12 to 14 which means that Hugo Boss is today highly overvalued by the market.
They pay out a good dividend of 3.8% however that corresponds to 95% of their earnings so also Hugo Boss needs to start bringing home some more money.

Conclusion: Hugo Boss had a bad year and the market punished them for it. The P/E is therefore high, they had to decrease their dividend payment, P/B is high etc. Graham would not find this company of interest but I did however and I will remain as a shareholder for the time being.

Thursday, 11 May 2017

Hugo Boss annual report 2016


Front page of the annual 2016 report from Hugo Boss

For the report in full please click here and unfortunately there are no previous summary but to find out more concerning Hugo Boss from a very, very old analysis then please go to analysis of Hugo Boss.

Looking at the table below then we see that sales did indeed drop down during 2016 and most of that was from Americas but the big downside comes in a massive drop in earnings. One big chunk of costs came from Hugo Boss closing down around 20 stores that were not profitable (66 millions) so let is hope that that is truly a one off cost. I am amazed that they have managed to keep as well as generally have such a high gross profit margin of 66%. That probably explains my unhappiness when I bought my suit there many years ago.


Financial statement for Hugo Boss 2016

Conclusion: Hugo Boss had a bad year and several investors were unhappy with the managements decision how to progress in the future. Based on my own experiences it was on a dip like this that I bought Adidas and I hope that in 2 to 3 years from now that I will be able to sell Hugo Boss with a profit of well over 100%. I will remain as a shareholder.

Wednesday, 10 May 2017

Analysis of Fast Retailing 2017


Logo of Fast Retailing 2017


Company: Fast Retailing

ISIN JP3802300008 | WKN 891638

Business: A Japanese retail group. They stand on a couple of brand pillars: UNIQLO (their largest brand), GU (offer low price fashion), Theory (offering fashion for the contemporary woman, launched in New York), COMPTOIR DES COTONNIERS (French origin offering fashion for women), PRINCESSE tam·tam (also French origin offering "lingerie made by women for women") & finally J BRAND (Californian origin offering fashion denim). My interest was aroused due to an UNIQLO store that appeared in Berlin.

Active: Highly brand based but with their biggest one Uniqlo they are present in Japan, China, Hong Kong, Taiwan, South Korea, Singapore, Malaysia, Thailand, Philippines, Indonesia, Australia, USA, UK, France, Germany, Russia and in Belgium. 

P/E: 83.4

Contrarian analysis of Fast Retailing 2017

The P/E of Fast Retailing is crazy high with over 80 and the P/B is also not good with 6.7 which gives a very clear no go from Graham. Their earnings to sales I find very, very low with 3% and the ROE has taken a deep dive and is now down at 8%. The book to debt have significantly changed since last year and it is now down at a ratio of 1 which means that they have almost doubled their debt and one need to start to wonder what the shareholders got for that.
in the last five years they have grown their yearly revenue by 14% which is really good and due to this we receive a motivated P/E of around 33 to 36 which means that fast Retailing is highly overvalued on the market today. Last year was however not a good year for them.
They pay a silly dividend of 0.9% which badly enough correspond to 77% of their earnings so it is very clear that they need to push up their earnings.

Conclusion: Graham says a very clear no to Fast Retailing and I am also not very happy of the development. They have very clearly problems on their home market which is such a large part of their business that even if things are going well internationally they are not able to compensate for the ground losses at home in Japan.I hope that this is a temporary fashion issue that can be turned around within an acceptable timeline. I will remain as a grumpy shareholder.